¶ Private Ledger Billing
Status: verified against the live app, 10 September 2026.
¶ What you'll be able to do
After reading this guide you will understand how private treatment is billed and paid in VeriPath Dental, and how to read the practice's financial screen — the month's revenue, the split between private charges and NHS patient charges, what has been collected and what is still due.
Who does this? The Financial area belongs to the practice manager / admin. Reception takes payments through Take Payment; clinicians can see Invoices but not the Financial area.
Related guides: Invoicing (ERPNext) for what happens to each charge, State-Subsidised FP17 Claim Submission for the NHS side, and NHS Contract & FP17 Claims — The Full Journey for the whole picture.
¶ About private billing
Private treatment is billed from the practice's Price List. When a private course of treatment is closed and billed, the app raises a charge for each completed appointment at the price-list price for that appointment type. Nothing is charged at booking or on arrival.
Each charge is recorded as a transaction on the appointment, holding:
| Field | What it records |
|---|---|
| Total amount | The full amount owed for that appointment |
| Deposit | Any deposit collected against the charge (see below) |
| Payment method | How it was settled — Card, Cash, Bank transfer or Cheque |
| Payment status | Where the payment is in its lifecycle |
| Card reference | The card processor's identifier, for card payments |
Payment statuses:
| Status | Meaning |
|---|---|
| Pending | Raised, not yet collected |
| Partial | Some of the amount has been paid |
| Paid | The full amount has been collected |
| Refunded | The payment was returned — recorded as a status; there is no refund screen in the app |
Payment settings. Each practice has card-payment credentials, a deposit percentage and a currency under Payment Settings. In the current billing flow a private course is billed in full when it is closed — deposits are not collected at booking, so the Deposit column normally reads £0.00.
¶ Step 1 — Open the Financial area
- Log in to VeriPath Dental.
- Click Financial in the top navigation.
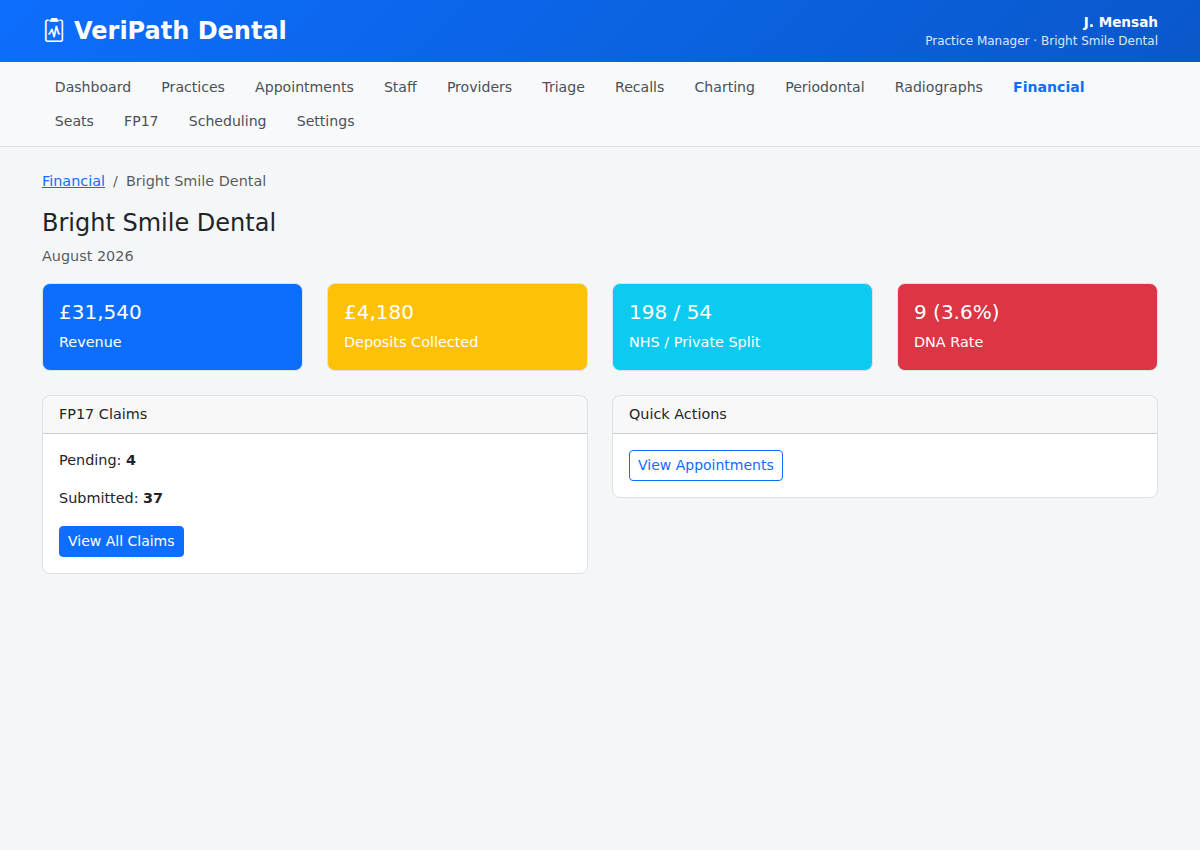
You land on your practice's financial screen for the current month. (If the tenant hosts more than one active practice you first choose the practice from a short list.)
¶ Step 2 — Read the headline cards
| Card | What it shows |
|---|---|
| Revenue | Payments recorded in the month |
| NHS Appointments | NHS-funded appointments this month |
| Private Appointments | Private appointments this month |
| Did Not Attend | Appointments the patient did not attend, with the rate |
The activity counts are mutually exclusive NHS / Private / DNA buckets for the month (cancelled appointments are excluded, and a DNA is never double-counted). Revenue measures payments recorded, not bookings made — so a month with work booked but nothing collected shows a low revenue figure, with a note telling you so.
¶ Step 3 — Read the revenue breakdown
Below the cards, the month's revenue is broken down so you can see where it came from and how much has landed:
| Panel | What it shows |
|---|---|
| Private | The private share of the month's charges |
| NHS / FP17 claims | The NHS patient charges raised through FP17 claims |
| Collected | What has actually been paid |
| Still due (pending / partial) | What is still owed |
Underneath sits the month's transactions, one row per charge: Date · Patient · Appointment · Funding Stream · Amount · Deposit · Payment Status. The Funding Stream badge tells you at a glance whether the money is a NHS FP17 charge (with its band and a link to the claim), a Private charge, or an NHS band charge.
¶ Step 4 — FP17 claims and quick actions
- FP17 Claims — this month — how many claims on the month's appointments are Draft, In submission (queued or transmitted), Accepted, or Needs attention (rejected or partially paid), with a View All Claims button.
- Quick Actions — jump to the month's appointments, or to Payment Settings.
¶ Taking the payment
Money owed appears in the Take Payment queue, which lists every appointment with an outstanding balance and the total to collect. From the row, Record payment takes the amount and the method (Card, Cash, Bank transfer or Cheque). Card payments are confirmed against the practice's card settings; if those are not configured the Card option is unavailable.
When the payment is recorded: the transaction moves to Paid, its invoice settles to Paid, and a matching Payment Entry is recorded in ERPNext.
¶ Useful tips
- Two streams, two destinations. Private charges post to Fee Income; NHS patient charges post to the NHS Patient Charges (Clearing) account. Both appear on this screen, but they are different money — the NHS charge is collected for the NHS and clawed back from the next contract payment.
- Still due is your chase list. The Pending and Partial figures are money owed; the Take Payment queue is where to collect it.
- Revenue is cash, not activity. For the NHS side, the practice's income is the UDA credit on accepted claims — see the full journey.